Excel remains the critical last mile for enterprise data: it's where backend computations, transactional data, and ETL results get distilled into something business stakeholders can immediately act on. With over 90% of employees relying on spreadsheets daily, Python-driven automation has become indispensable for eliminating repetitive manual work and freeing teams for higher-value tasks. This guide covers the 7 key elements of effective Python Excel automation: creating and modifying files, templating, cell formatting, chart embedding, data extraction, and performance considerations for large-scale deployments.
How to choose a Python Excel library
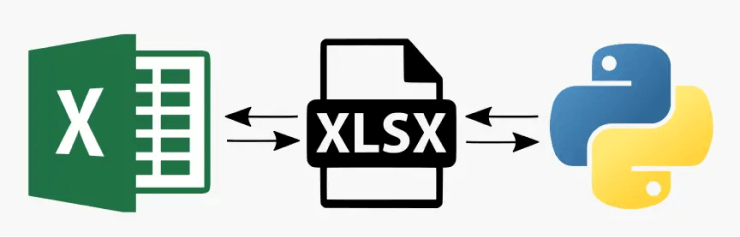
Selecting the right Python library for Excel automation is especially important in data engineering contexts, where scalability, integration with databases, and memory efficiency often determine whether a solution survives production workloads. Here are the three most popular libraries, evaluated through the lens of real-world ETL and reporting pipelines, along with their pros and cons:
Pandas
Primarily a data manipulation and analysis library, the Pandas library offers support for importing and analyzing Excel data via its read_excel function. It provides a straightforward API and excels in handling large datasets across various file formats.
| Pros | Cons |
|---|---|
|
|
In enterprise ETL workflows, Pandas truly shines when bridging databases and Excel. A common pattern I use involves reading directly from PostgreSQL with SQLAlchemy, applying transformations, and exporting a polished report:
import pandas as pd
from sqlalchemy import create_engine

# Establish connection to PostgreSQL (or any DB)
engine = create_engine("postgresql+psycopg2://user:password@host:5432/dbname")

# Load and transform data in one go
df = pd.read_sql_query("""
    SELECT order_id, customer_name, order_date, quantity, unit_price,
           (quantity * unit_price) AS total_amount
    FROM orders
    WHERE order_date >= '2025-01-01'
""", engine)

# Additional Pandas transformations common in reporting
df['order_date'] = pd.to_datetime(df['order_date']).dt.strftime('%Y-%m-%d')
df = df.sort_values('total_amount', ascending=False)

# Export with professional formatting
with pd.ExcelWriter('sales_report.xlsx', engine='openpyxl') as writer:
    df.to_excel(writer, sheet_name='Orders', index=False)

    # Access the worksheet for formatting
    worksheet = writer.sheets['Orders']

    # Auto-adjust column widths
    for column in worksheet.columns:
        max_length = 0
        column_letter = column[0].column_letter
        for cell in column:
            try:
                if len(str(cell.value)) > max_length:
                    max_length = len(str(cell.value))
            except:
                pass
        adjusted_width = max_length + 2
        worksheet.column_dimensions[column_letter].width = adjusted_width

    # Apply number formatting to currency columns
    for row in worksheet.iter_rows(min_row=2, min_col=6, max_col=6):
        for cell in row:
            cell.number_format = '$#,##0.00'

    # Freeze header row
    worksheet.freeze_panes = 'A2'
This approach turns raw database output into a ready-to-share Excel deliverable in just a few lines while maintaining full control over presentation.
XlsxWriter
This library is specifically designed for creating new .xlsx files using Python. It offers extensive formatting options and features like conditional formatting, charts, and images.
| Pros | Cons |
|---|---|
|
|
Openpyxl
Unlike XlsxWriter, with Openpyxl, both reading and writing data to Excel files using Python is possible. While it provides comprehensive features for Excel file interaction, it does perform slower in writing operations compared to XlsxWriter.
| Pros | Cons |
|---|---|
|
|
XlsxTemplate (Excel-based templating)
This library is a bit different than the others we’ve looked at. Instead of using Python code to generate an Excel output file, you create a template in Excel that contains placeholders that will be filled with data during the automation process.
| Pros | Cons |
|---|---|
|
|
7 key elements of Python Excel automation
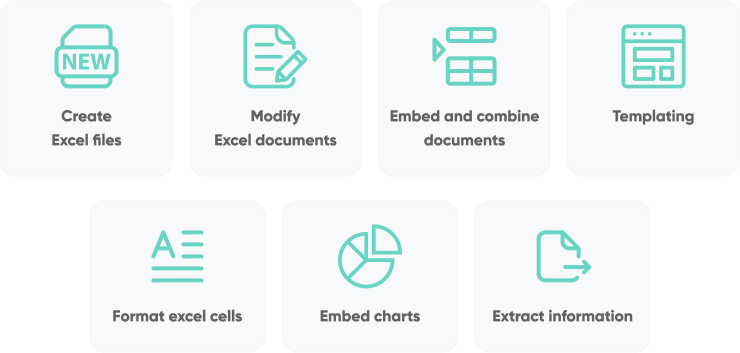
Now that we’ve reviewed some of the most popular Python libraries for Excel automation, let’s dive into the top 7 excel automation tasks you can perform using Python, tasks we regularly apply when delivering production reports from enterprise data pipelines:
Create Excel spreadsheets
Creating Excel documents with Python libraries is foundational to many automation projects. There are two main methods to create Excel documents with Python:
Method 1: Generating Excel documents from scratch with Python
Libraries like XlsxWriter allow you to create new Excel spreadsheets from scratch with Python code. This method works well if you prefer to customize each new Excel sheet without templates and generally if you prefer to work in Python code.
| Pros | Cons |
|---|---|
|
|
Method 2: Generating Excel documents from templates
On the other hand, libraries like xlsx-template are built around templating (which we’ll get to in a later section of this article). Instead of building out automation using Python, you manage most of the work using a single Excel file template that contains a series of tags.
| Pros | Cons |
|---|---|
|
|
Modify an Excel file
Python isn’t just for generating new files; it can also be used to modify existing files. Here are some of the key operations you can perform on an existing Excel sheet:
- Edit existing data in cells, rows, and columns
- Add new data into your worksheets
- Delete data from rows, columns, and cells
- Manipulate functions and write Excel formulas
- Change cell formatting and styles
PRO TIP: Understanding how content is managed in Excel is crucial to understanding how Excel documents are represented in Python. For instance, when using Openpyxl:
- The Workbook object represents the Excel file.
- Each Workbook can contain multiple sheets that are represented by the Worksheet object.
- Every Worksheet object consists of Rows and Columns, represented as lists in Python.
- Cells in particular can be accessed and modified, granting you the ability to get or modify the data each cell contains.
Embed and combine documents
Python's capabilities extend beyond simple spreadsheet manipulation, allowing for advanced integration and modification of Excel docs. For example, with Python libraries you can embed other file types, like PDFs, directly into the spreadsheet.
Using Python, you can also merge two Excel files into a consolidated spreadsheet or split a large file into several smaller ones. From there you could analyze the data of the merged file or perform other computations.
Templating with Excel files
Templating using Python, especially for Excel automation, ushers in a way to produce highly customizable and dynamic Excel spreadsheets. Templating languages like Jinja2, when used with Python Excel libraries, can alter the content, formatting styles, and even structure of an Excel file based on input data or business rules.
A standout option for templating is xlsxTemplate. Operating in a similar mode as if Excel were a powerful layout engine (which it actually is), it allows you to harness Excel formula, layout, and formatting features by mixing it with the logic control offered by templating engines. Let’s look at an example.
Example 1: Use a template to add text
Python code creates an Excel file (template.xlsx) with placeholder values enclosed in double curly brackets, similar to {{ placeholder }}.
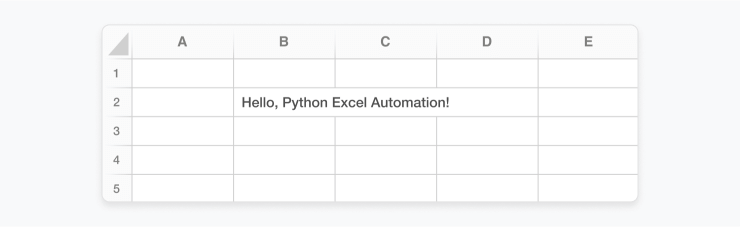
Then, use Python scripts to replace these placeholders with actual data.
from openpyxl import load_workbook

# Load Excel template
wb = load_workbook('template.xlsx')
sheet = wb.active

# Define the actual data
data = {'placeholder': 'Hello, Python Excel Automation!'}

# Replace cell value placeholders with actual data
for row in sheet.iter_rows():
    for cell in row:
        if cell.value is not None and isinstance(cell.value, str):
            for key in data.keys():
                if '{{' + key + '}}' in cell.value:
                    cell.value = cell.value.replace('{{' + key + '}}', data[key])

wb.save('output.xlsx')
In the example above, the python script reads the Excel file, scans each cell for placeholders, and if found, replaces them with the actual data.
Format Excel cells
Python libraries offer various options to format the cells within your Excel spreadsheet. This allows you to apply styles and changes that enhance the presentation of your document and make it more understandable and appealing. Here are some options for cell formatting you can accomplish with libraries like Openpyxl:
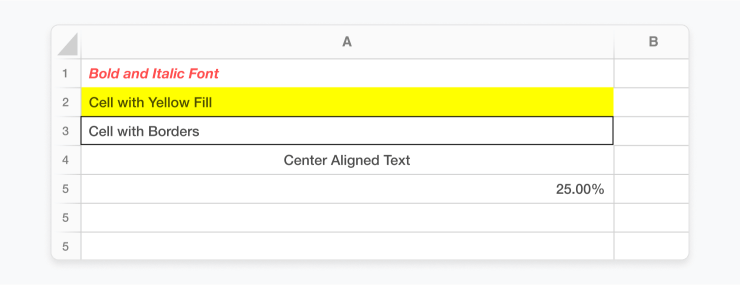
Example 1: Modify font styles
Openpyxl has tools to modify the font properties like name, size, color, bold, italic, underline, and more. You can highlight important information or make your text aesthetically pleasing.
from openpyxl.styles import Font, Color

cell = ws['A1']
cell.value = "Bold and Italic Font"
cell.font = Font(bold=True, italic=True, color="FF0000")
Example 2: Manage number formats
Manage the way numbers are displayed in cells. You can set format codes to control number precision, insert dollar signs, represent percentages, etc.
cell = ws['A5']
cell.value = 0.25
cell.number_format = '0.00%'
Below is a screenshot which incorporates all styling methods mentioned above.
Embed charts
Much like with Python Word automation, Python libraries offer a way to embed charts directly into Excel files. The process looks different depending on the library you work with. There are two main options we’ll focus on here. XlsxWriter offers more advanced features and customization options, making it suitable for complex charting requirements. On the other hand, Openpyxl provides a simpler interface for basic charting needs and is more intuitive for beginners.
| XlsxWriter | Openpyxl |
|---|---|
|
|
Now let’s look at an example code snippet using these two libraries:
Example 1: Insert charts with XlsxWriter
import xlsxwriter

# Create a new Excel workbook
workbook = xlsxwriter.Workbook('charts_with_XlsxWriter.xlsx')
worksheet = workbook.add_worksheet()

# Write some data to add to the chart
data = [10, 40, 50, 20, 10]
worksheet.write_column('A1', data)

# Create a chart object
chart = workbook.add_chart({'type': 'line'})

# Configure the series for the chart
chart.add_series({'values': '=Sheet1!$A$1:$A$5'})

# Insert the chart into the worksheet
worksheet.insert_chart('C1', chart)

# Close the workbook
workbook.close()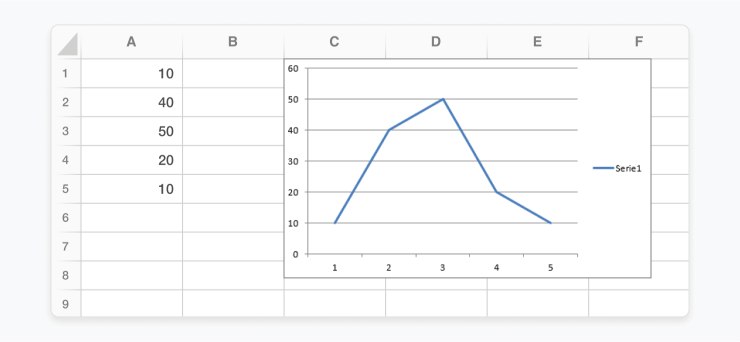
Example 2: Insert charts with Openpyxl
from openpyxl import Workbook
from openpyxl.chart import LineChart, Reference

# Create a new workbook
wb = Workbook()
ws = wb.active

# Add data to the worksheet
data = [10, 40, 50, 20, 10]

for i, value in enumerate(data, start=1):
    ws.cell(row=i, column=1, value=value)

# Create a chart
chart = LineChart()
chart.add_data(Reference(ws, min_col=1, min_row=1, max_col=1, max_row=len(data)))

# Add the chart to the worksheet
ws.add_chart(chart, "C1")

# Save the workbook
wb.save("charts_with_openpyxl.xlsx")
PRO TIP: In addition to XlsxWriter and Openpyxl, there are other libraries available for adding charts to Excel in Python. While these may not be as widely used or feature-rich as the two main contenders, they offer alternative options for specific use cases:
- Pandas: Although Pandas itself does not directly add charts to Excel, you can save Matplotlib or Seaborn plots as images and then insert them into Excel with Pandas.
- Xlwings: While its primary focus is on integrating Python with Excel for automation and data analysis, it also provides functionality for adding charts to Excel workbooks. Xlwings may be preferred by users who prefer working directly within Excel for chart creation and manipulation.
- Plotly: While it is primarily used for creating interactive charts in web applications or Jupyter notebooks, Plotly can also be used to generate static images of charts, which can then be inserted into a new Excel file using XlsxWriter or Openpyxl.
Extract information
Python libraries, such as Openpyxl and Pandas, provide robust capabilities to traverse through rows and columns of a sheet, or pivot tables, to export data and further process the required Excel data.This feature gets extremely useful when working with bulky datasets or documents filled with numerical data.
Example 1: Read and extract data using Pandas
In this example we use Pandas to open the specified Excel document using the Pandas read_excel function, which then reads all the data and prints it. If the document contains multiple sheets, you might want to specify the sheet name or index in the read_excel function.
import pandas as pd

def read_excel_data(filename):
    data = pd.read_excel(filename)
    return data

print(read_excel_data('test.xlsx'))
PRO TIP: Developers and data analysts are not just limited to extracting and printing the data. Once you have access to it, you could perform a plethora of tasks like:
- Clean, filter and process the Excel data
- Use Pandas or other Python modules for data analysis
- Leverage Matplotlib for data visualization
- Apply Sklearn for Machine Learning tasks
High-Performance Excel Generation for Large Datasets
In data engineering projects for ERP and WMS platforms, generating Excel reports from 100k+ row datasets is routine. Standard in-memory approaches quickly exhaust RAM and slow down pipelines. Openpyxl’s write-only mode streams data directly to disk, dramatically reducing memory consumption while maintaining compatibility with all standard Excel features.
Here’s a production-ready pattern using chunked processing:
from openpyxl import Workbook
import time

def generate_large_report(data_generator, output_file='large_report.xlsx'):
    start = time.time()
    wb = Workbook(write_only=True)
    ws = wb.create_sheet('Report')

    # Write header row
    ws.append(['ID', 'Date', 'Customer', 'Amount', 'Status'])

    row_count = 0
    for chunk in data_generator:  # e.g., SQLAlchemy yield_per() or Pandas chunks
        for row in chunk:
            ws.append(row)
            row_count += 1
            if row_count % 50000 == 0:
                print(f"Processed {row_count} rows...")

    wb.save(output_file)
    print(f"Successfully wrote {row_count} rows to {output_file} in {time.time() - start:.1f}s")

# Example usage with a generator (replace with your DB query)
def get_data_in_chunks(batch_size=10000):
    # Simulate or use SQLAlchemy session.execute(..., yield_per=batch_size)
    for i in range(15):  # 150k rows total
        yield [[j, f'2025-04-{j%30+1}', f'Customer_{j}', j * 42.5, 'Active'] for j in range(i * batch_size, (i + 1) * batch_size)]

generate_large_report(get_data_in_chunks())
This technique keeps memory usage low even for massive exports and integrates seamlessly into Dagster assets or Celery tasks.
Real-World Pitfalls in Enterprise Excel Automation
- Character encoding issues: Special characters from ERP systems (Polish ł, ą, Ś, or emojis) can break exports unless you explicitly use UTF-8 encoding and test with real production data.
- Datetime timezone handling: Excel stores naive datetimes; always convert to a consistent timezone (usually UTC) in Python before writing, or risk off-by-one-hour errors in global reports.
- Excel’s 1,048,576 row limit: Hit this ceiling in large WMS extracts; always implement chunking logic to split across multiple sheets or files automatically.
- Formula evaluation: Openpyxl writes formulas correctly but does not compute their results (unlike Excel itself). Pre-calculate values in Pandas when the downstream consumer expects literal numbers rather than formulas.
Scheduling Automated Excel Generation in Production
One-off scripts are useful for development, but real business impact comes when Excel generation runs automatically as part of your data pipeline. In production environments I orchestrate these processes with:
- Cron jobs for lightweight, standalone scripts on Linux servers or EC2 instances.
- Celery for asynchronous tasks triggered by web applications or API events.
- Dagster to treat Excel reports as first-class assets, complete with lineage, retries, and alerts when a pipeline fails before the final export.
Scheduling turns Excel automation from a manual convenience into a reliable, observable part of your enterprise data platform.
Excel automation with SoftKraft
If you’re looking for a development team to bring your document processing vision to life, we’d love to help. We offer Python development outsourcing that simplify the implementation process, enabling you to achieve business results without the hassle. Our team will guide you in selecting the right Python library, planning development, and building an end-to-end solution that perfectly aligns with your business requirements.

Conclusion
Python’s tight integration with Excel gives data engineers a powerful way to close the loop on complex pipelines, delivering polished, performant spreadsheets that business users trust and understand. From high-volume write-only exports and sophisticated ETL transformations with Pandas to templated reports and scheduled orchestration, these techniques eliminate manual drudgery and scale effortlessly with enterprise demands. By applying the patterns outlined here, you can turn Excel from a frequent pain point into a strategic advantage that surfaces insights exactly where your organization needs them most.